HistoryShots InfoArt
Visual History of Financial Crises
Product Description
A comprehensive yet accessible view into the historical and current cycles of financial crises over a 200-year period, Visual History of Financial Crises was created in partnership with the Princeton University Press. Using data developed by world-renowned economists Carmen M. Reinhart and Kenneth S. Rogoff, it maps the cyclical history of financial crisis since 1810 for sixty-six countries representing 90% of world GDP.
The giant wave in the top section of the graphic depicts the percentage of world GDP by region in crisis during the 200-year period. The bottom section provides a detailed chart of all sovereign defaults by country, region and year showing the repeating nature of sovereign default. This print has a thin white border around the complete print.
Product Details
- Measurements
36"W x 24"H
- OriginUnited States
— Original Or Replica: Replica
— Print Type: Print
— Print Material: Archival Paper
— Framed: Unframed
Shipping Information
-
Shipping AvailabilityUnited States
-
Shipping PolicyStandard Ground Shipping
-
Ship In2-3 weeks ⓘ
-
Return PolicyFinal sale, not eligible for return or cancellation


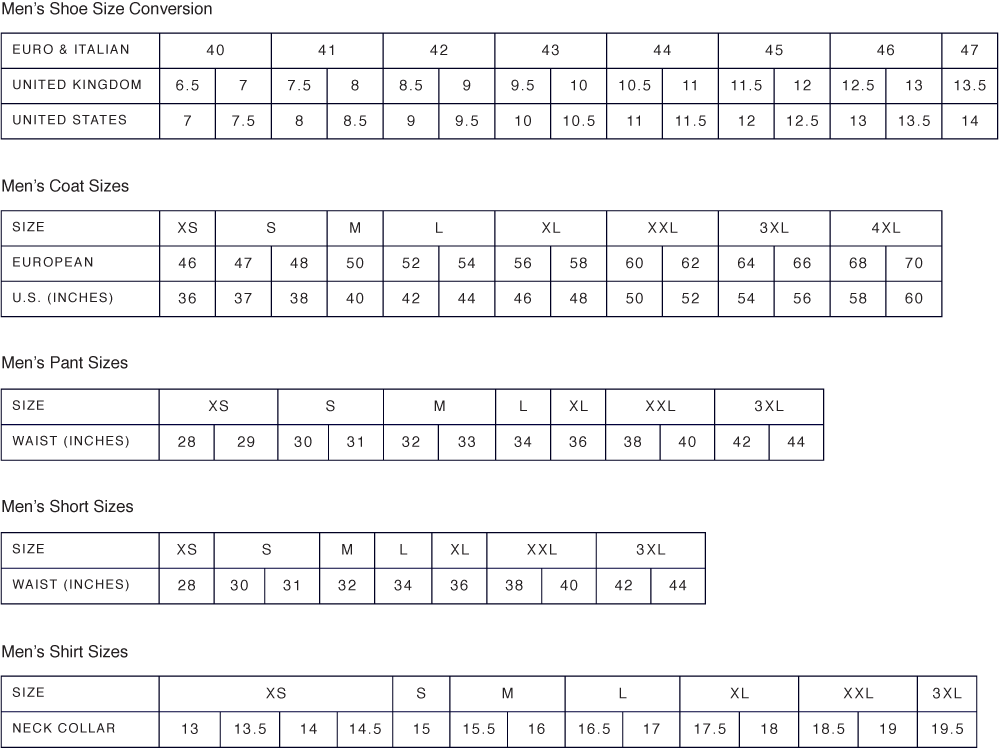
Size Chart